 By admin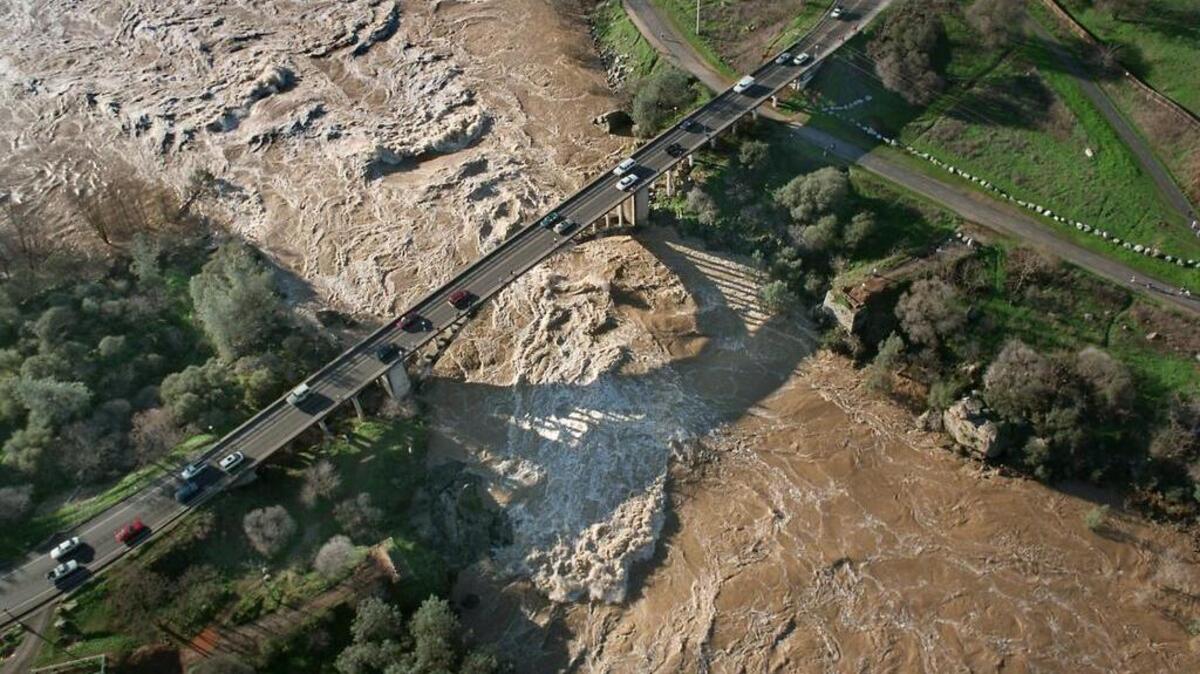
Strong El Niño events are commonly associated with wet winters for the Golden State. As the jet stream and atmospheric rivers that dowse the Pacific Northwest in normal winters get pulled south into California by El Niño, they also become supercharged thanks to warmer ocean temperatures.
Read more Six Starters Who Must Play in Lions Preseason Game Against Commanders
And as the ongoing “Super El Niño” continues to strengthen, long-range climate models are already studying this scenario and projecting what it could mean for California as winter nears.
Strong El Niño can bring California more winter rain, floods
To understand the wet picture that is emerging, it is important to understand what climate models are.
Weather models, such as the ones that feed the weather app you use on your phone, calculate specific conditions throughout the time of day. This includes any specific clouds or storms or fronts, and when and where any of those features might arise. Most of these models forecast out several days to a week or two.
Climate models zoom way out. There are no individual fronts or storms to calculate here. Instead, climate models look at the global atmospheric pattern, from sea surface temperatures to the jet stream, and simulate what is likely to happen weeks or months out from the present.
The National Oceanographic and Atmospheric Administration’s own climate model, the Climate Forecast System (CFSv2), is one of a number of climate models pointing to a wetter than normal winter.
For both December and January, the CFSv2 registers extra precipitation across nearly the entire state. This boost is on the order of several inches in addition to the normally expected rainfall, with some regional variation in between.
For reference, Sacramento typically sees around 3.5 inches of monthly rainfall for both December and January. San Francisco averages about an inch more and Los Angeles an inch less. Under the CFSv2 scenario, nearly all of these locations would be expected to see an additional 2 to 5 inches each month. A strong signal for a wet winter is already in view months ahead of time.
It is worth noting that the CFSv2 runs four times daily, and that the maps shown here are only utilizing one of these runs. That said, all the individual runs generally show the same pattern — a much wetter than normal December through February across the state.
And this pattern is not only found in this individual model. There are a number of other climate models that show a similar pattern. The pattern is still solid when averaging across five different models, with a 40% to 65% precipitation boost statewide. None of these five models register any below average precipitation at any of the assessed California cities for either December or January.
The additional rainfall, if it were to fall within a short timeframe, such as during an intense atmospheric river event, could lead to localized flooding and mudslides if the existing water management infrastructure fails to accommodate billions of gallons of extra water. Atmospheric rivers do not fall across the entire state, and any event would be both more localized and more intense than what our climate models are depicting.
Will boosted precipitation mean more Sierra snow?
Of course, rain is not the only precipitation set to fall this winter. At altitude across Northern California, extra moisture from El Niño could mean more snowfall than would otherwise be expected. That distinction between elevation and latitude is an important one.
Read more Premier League ‘Agree’ to Incredible Broadcast Change With Disastrous History
Strong El Niños, despite oftentimes offering more precipitation for California, also carry with them warmer temperatures thanks to a warmer Pacific Ocean to the west. The increased warmth of the sea will mean the difference between rain and snow in many locations, especially in Northern California where the warmth looks to be more pronounced.
Increased temperatures will push the rain-snow line higher in the mountains than normal. That could be felt in a few months time as less snow sticking the foothills.
That being accounted for, a strong signal for more snow still emerges in the models at altitude. Combining the climate model signals of increased precipitation and warmth with elevation, we can get a rough idea for what winter snowfall might look like — it is noticeably boosted come December and January.
This is especially true for the Sierra and North Coast ranges, where extra snowfall could come in the form of significantly higher-than-normal totals in the high peaks.
There are a few important caveats here to consider. First, November is not winter: An early start for increased precipitation and snow is not looking like a sure thing, so more rain and snow does not mean that the wet season will start ahead of schedule.
Secondly, more snow does not necessarily always translate to more snowpack even though it likely will. Warmer stretches throughout winter could actually melt additional snow with time, although consistent heavy snow would greatly counteract that melting. We did not account for any melting in our modeling, and only calculated a rough approximation for additional snowfall.
El Niño is still rapidly strengthening
You are likely to hear and read about this El Niño a lot the coming months, and for good reason: It is probable that this event will be the strongest on record by a wide margin.
In last month’s story explaining the El Niño pattern, the anomaly in the Niño 3.4 region was at about 1.7 degrees Celsius above normal. As of mid-August, it has risen to dramatically to over 2.7 degrees Celsius, with a forecasted range around 4 degrees Celsius above average come November. For reference, the previous strongest El Niño on record was in 2015 with a peak anomaly of 2.78 degrees Celsius above average. And it’s worth noting this record is potentially tied or beaten by the 1877 Super El Niño when data was far coarser, but which could have had a peak strength of 3.5 degrees Celsius using reconstructed sea surface temperature records. That El Niño is attributed to tens of millions of deaths from global famine.
Projections continue to trend higher with the strength of this El Niño as it continues to outrun those very same projections. A chain of tropical cyclones — hurricanes and typhoons — have also aided in pushing more water eastward along the equator over the past month, further stacking up warm water in the Niño 3.4 region. This is the case with Hurricane Lala, which impacted Hawaii over the weekend, and will likely be the case as more tropical systems develop.
As tropical storm #Lala pushes towards Hawaii, it is helping drag a plume of more westerly winds along the equator. Just another westerly wind burst to help the already historic El Niño reach greater heights. pic.twitter.com/JcuEyGE4TN
Read more SI:AM | Another Twist in the Kawhi Leonard Saga
— Sean Macaday (@MacadayWX) August 15, 2026
This story was originally published August 18, 2026 at 7:00 AM.